8 Maps Show Plastics’ Global Impact
How do we impulse students to become curious about a world they have not seen or cannot imagine? Educational Technology can ensure that we take our jobs as “Global Connectors” seriously, that we strive to connect our #students to the #GreaterGood (whatever that really means)! Images, maps, photos, videos, Instagram, Twitter all of these #edtech tools can support that #BigPicture. Seriously, have you ever discussed the impact of the use of plastic on the world’s oceans and water sources? Take a look at: A Plastic Ocean
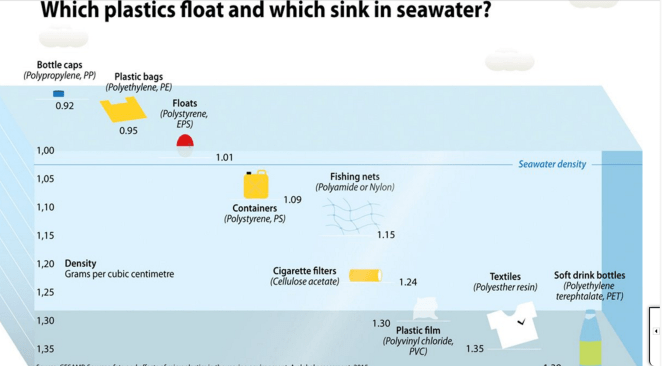
And where can we go from there? Use the #online community you create to discuss and link your students to this crucial issue. The amazing map resource offered by 8 Maps can be used to link your classroom to the #BigIssue, create experiments in plastic types and whether they sink or float and start #OnlineCommunities that become #AdventureLearning projects that morph into #CommunityProjects. 
Think I’m crazy? I have been accused of worse and lived to tell the tale. Gotta start somewhere and linking your classroom to the classroom across the city via #GoogleHangouts or in your #Schoology classroom in order to solve your city’s plastic problem? Why not try it? And then, link to a classroom in Spain, or in Peru, or in Guam or in Puerto Rico…and do it again. I dare you.
